EN
EN
Bitcoin, the world's most popular cryptocurrency, operates on a decentralized network that relies on confirmed transactions by participants known as miners. Knowing how to check Bitcoin transaction confirmation helps ensure its legitimacy and prevents double-spending. This article will guide you through checking Bitcoin transaction confirmation, providing you with the necessary tools and knowledge to verify the status of your transactions.
Understanding Bitcoin Confirmations
When you send a Bitcoin transaction, it initiates a process that involves several key steps and concepts. One important aspect to grasp is how to check Bitcoin transaction confirmation, which ensures the legitimacy and security of your transactions. Let's study the intricacies of Bitcoin confirmations, covering the mempool, miners, block validation, and the significance of confirmations in establishing trust within the network.
1. The Mempool and Transaction Propagation:
Upon initiating a Bitcoin transaction, it is first broadcasted to the network. From there, it enters the mempool, a temporary storage space for pending, unconfirmed Bitcoin transactions. The mempool is a pool of transactions waiting to be included in the next block. Miners and nodes in the network can access the mempool to select transactions they wish to have in the blocks they are mining.
2. Miners and Block Validation:
Miners play a fundamental role in the Bitcoin network. They are responsible for validating and adding transactions to the blockchain. Miners participate in solving complicated mathematical puzzles, known as proof-of-work, to earn rewards. These rewards include newly minted Bitcoins and transaction fees associated with their transactions in a block. By dedicating computational power to solving these puzzles, miners ensure the security and integrity of the blockchain. When a miner solves a puzzle, they create a new block. This block contains a collection of transactions, including yours, if it was selected from the mempool. Miners prioritize transactions based on various factors, such as transaction fees, to maximize their earnings. Once a block is created, it is propagated across the network, and other miners validate it to ensure its adherence to the rules of the Bitcoin protocol. Gaining a comprehensive knowledge of the role of miners is essential when learning how to check Bitcoin transaction confirmation effectively.
3. Confirmation Process:
It becomes confirmed when a miner includes your transaction in a block and adds it to the blockchain. Bitcoin confirmations represent the number of blocks added to the blockchain after your transaction. Each subsequent block adds another confirmation, increasing the security and trust associated with the transaction. For example, if your transaction has one confirmation, it is included in the latest block added to the blockchain. If it has two confirmations, it is present in the second block after the one in which it was initially included, and so on. The more confirmations a transaction has, the further complex and resource-intensive it becomes for an attacker to reverse or tamper with it.
4. Importance of Confirmations:
Confirmations serve as a measure of trust and finality in the Bitcoin network. As more blocks are included in the blockchain, the likelihood of a transaction being reversed or altered decreases significantly. Bitcoin's design ensures that once a transaction has a sufficient number of confirmations, it is practically immutable, providing a high level of security for participants in the network. The recommended number of confirmations to consider a transaction as fully secure varies depending on the value and sensitivity of the transaction. For small, low-value transactions, a single confirmation may be sufficient. However, waiting for multiple confirmations for larger transactions or those involving significant value is generally recommended, with six confirmations considered highly secure.

How to Check Bitcoin Transaction Confirmation with Blockchain Explorers
Blockchain explorers play a vital role in the world of cryptocurrencies, allowing users to gain insights into the Bitcoin blockchain and retrieve detailed information about transactions. These online platforms provide a user-friendly interface to explore the blockchain, search for specific transactions, and verify the confirmation status of Bitcoin transactions.
1. Choosing a Blockchain Explorer:
Several famous blockchain explorers are available, with features and user interfaces. When selecting a blockchain explorer, consider factors such as reputation, reliability, user experience, and the specific features of each platform. It's essential to choose a reputable explorer to ensure accuracy. A good example is Blockchain.com.
2. Locating the Transaction:
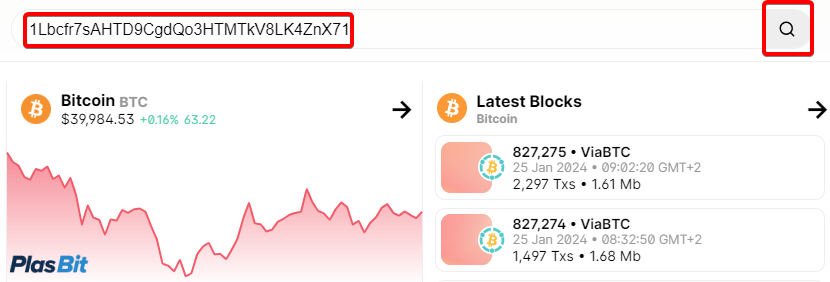
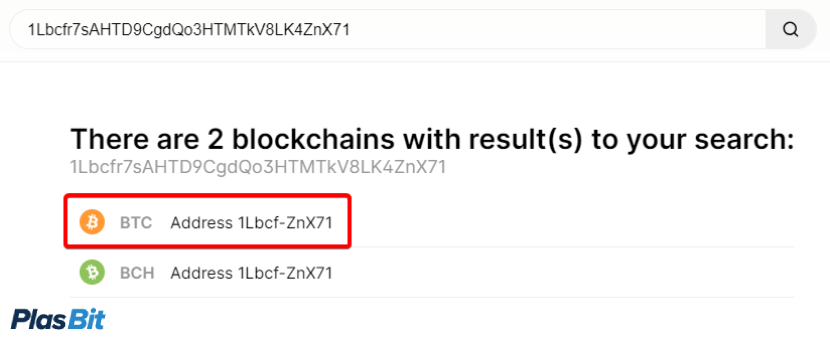
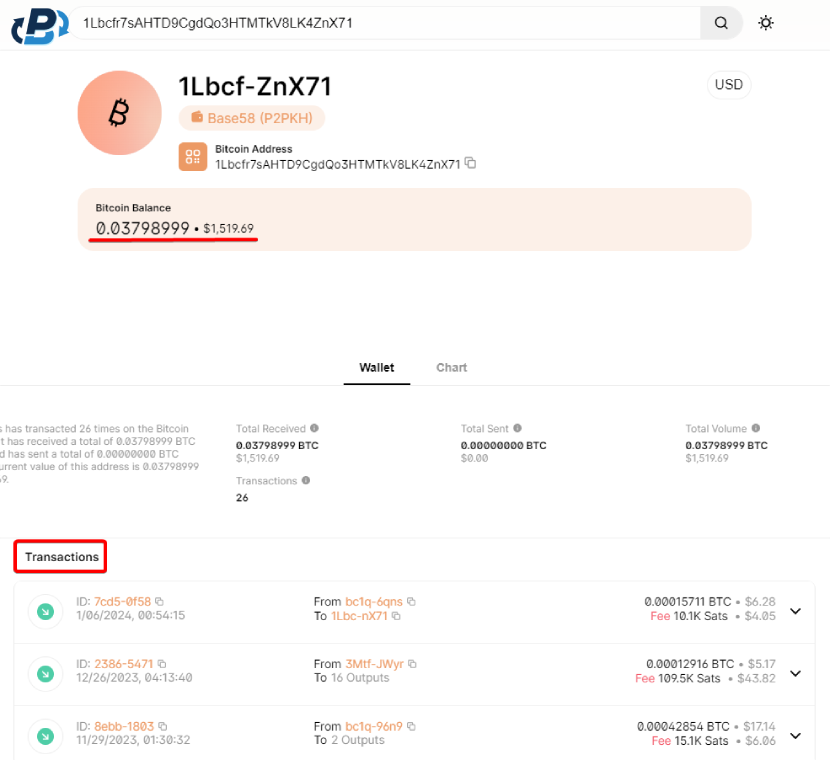
Once you have chosen a blockchain explorer, the next step is to locate your Bitcoin transaction. To do this, you will need the transaction ID (TxID) or the Bitcoin wallet address associated with the transaction. The transaction ID is a unique identifier allocated to each transaction on the blockchain. If you don't have the transaction ID, you can use your Bitcoin wallet address to search for transactions associated with that address. Enter the transaction ID or Bitcoin wallet address into the search bar on the chosen blockchain explorer's website. After initiating the search, the explorer will display a transaction page containing relevant details about the transaction.
3. Checking Confirmation Status:
On the transaction page, you will locate vast information that can help you understand the confirmation status of your Bitcoin transaction. Key details typically include the number of confirmations, block height, transaction fees, and the receiving and sending addresses involved in the transaction. The number of confirmations is crucial as it indicates the level of trust and finality associated with the transaction. When a transaction receives its first confirmation, it has been successfully incorporated into a block and added to the blockchain. As subsequent blocks are added to the blockchain, the number of confirmations increases, thereby enhancing the security and immutability of the transaction. In addition to the number of confirmations, the transaction page may provide the block height, which refers to the block's position containing the transaction within the blockchain. This information can help track the transaction's progress and identify its relative position in the blockchain's history. Transaction fees are another vital aspect displayed on the transaction page. They represent the amount miners pay for, including the transaction in a block. Higher transaction fees generally incentivize miners to prioritize the transaction, potentially leading to faster confirmations. Furthermore, the receiving and sending addresses listed on the transaction page allow you to verify the accuracy of the transaction and ensure that the funds have been sent to the intended recipient.
Monitoring Confirmation Progress
Monitoring the confirmation progress of your Bitcoin transactions is essential to ensure their successful inclusion in the blockchain and to gauge the level of security associated with each transaction. While Bitcoin transactions typically undergo smooth confirmation processes, delays can occur due to network congestion or low transaction fees. Let's discuss how to check Bitcoin transaction confirmation by monitoring the confirmation progress of your transactions effectively.
1. Observe Initial Confirmation:
Once you have initiated a Bitcoin transaction and it has been broadcasted to the network, it is crucial to observe the initial confirmation. This confirmation indicates that a miner has included your transaction in a block and is on its way to being added to the blockchain. To check for the initial confirmation, you can utilize a blockchain explorer and search for your transaction using the transaction ID or Bitcoin wallet address.When you see the first confirmation on the blockchain explorer, it assures you that your transaction has been successfully included in a block. However, it is crucial to account that even with the first confirmation, there is still a slight possibility of the transaction being reversed, although the probability decreases significantly with each subsequent confirmation.
2. Tracking Confirmations:
To effectively stay updated on how to check Bitcoin transaction confirmation, reviewing the blockchain explorer periodically is recommended. Each new block added to the blockchain represents an additional confirmation for your transaction, enhancing its security and trustworthiness. The number of confirmations reflects the number of blocks attached to the blockchain since the inclusion of your transaction. By regularly monitoring the blockchain explorer, you can track the number of confirmations your transaction has received. This information provides insights into the progress of your transaction within the network and indicates the level of trust associated with it. As the number of confirmations increases, the probability of a transaction being reversed or tampered with diminishes significantly. Understanding how to check Bitcoin transaction confirmation through the blockchain explorer allows you to stay updated on the security and reliability of your transaction as more blocks are attached to the blockchain.
3. Confirmation Threshold:
While a single confirmation is generally considered secure for small transactions or those involving relatively low values, it is recommended to wait for multiple confirmations, especially for more significant transactions. Waiting for additional confirmations increases security and reduces the risk of potential attacks aimed at reversing or tampering with the transaction. The number of confirmations necessary to consider a transaction fully secure depends on various factors, including the transaction's value and sensitivity. Typically, six confirmations are considered highly safe, as it would require substantial computational power and resources to reverse the transaction after this point. However, it's worth noting that some platforms or services may have their own recommended confirmation threshold based on their risk tolerance. By waiting for a sufficient number of confirmations, you can have greater confidence in the finality and security of your Bitcoin transactions. It is essential to exercise patience and understand that confirmation times can vary depending on network conditions and transaction fees.
Alternative Confirmation Methods
In addition to using blockchain explorers, alternative methods are available to verify Bitcoin transaction confirmations. These methods offer convenience and faster access to confirmation information, enhancing the user experience and efficiency of transaction monitoring. Let's explore two such ways: wallet notifications and the Lightning Network.
A. Wallet Notifications:
Many Bitcoin wallets provide built-in notification features that can alert users when their transactions reach a certain number of confirmations. By enabling this feature, users can receive real-time updates about the confirmation progress of their transactions directly within their wallets. Wallet notifications eliminate the need to check a blockchain explorer to track confirmation status manually. Instead, users can rely on these notifications to stay informed about the progress of their transactions. This feature is handy for individuals who frequently engage in Bitcoin transactions and must stay up-to-date with the confirmation process. To benefit from wallet notifications, use a Bitcoin wallet that supports this feature. Check your wallet's settings or preferences section to enable notifications and configure the desired confirmation threshold. Once set up, you will receive alerts when your transactions reach the specified number of confirmations, providing peace of mind and lowering the need for manual monitoring. Our wallet offers a beginner-friendly user interface that is easy to navigate and manage your Bitcoins while upholding a paramount security infrastructure. Our wallet's private keys are encrypted with a Secure Enclave and protected with Biometric and 2-Factor Authentication.
B. Lightning Network:
The Lightning Network is a layer-2 created on the Bitcoin blockchain. It aims to address the scalability limitations of the leading Bitcoin network by enabling faster and cheaper transactions. In the Lightning Network, transactions occur off-chain, utilizing user payment channels. These channels allow parties to conduct multiple transactions without directly involving the main blockchain. Only the opening and closing of the payment channel require interaction with the blockchain. One of the key advantages of the Lightning Network is its near-instant confirmation time. Transactions within the Lightning Network can be confirmed within milliseconds, providing exceptional speed and efficiency. This makes the Lightning Network well-suited for small, frequent transactions or microtransactions that require immediate confirmation. However, remember that the Lightning Network is unsuitable for all transactions. It is primarily designed for lower-value transactions and may require specific setups and configurations. Additionally, both parties involved in a Lightning Network transaction must have compatible Lightning Network wallets and established channels. By leveraging the Lightning Network, users can benefit from faster and more cost-effective transactions, reducing the reliance on traditional blockchain confirmations.
Conclusion
Checking Bitcoin transaction confirmations is crucial for ensuring the legitimacy and finality of your transactions. By utilizing blockchain explorers, you can easily monitor the confirmation progress, gaining insights into the security of your transactions. Remember to wait for appropriate confirmations, especially for more significant transactions, to reduce the risk of double spending or a transaction reversal. As the Bitcoin network continues to evolve, alternative methods such as wallet notifications and the Lightning Network offer additional tracking and verifying confirmations options. Stay informed about the latest progress in Bitcoin technology to leverage these advancements and enhance your transaction confirmation experience. Always exercise caution and double-check the information provided by blockchain explorers or other tools to avoid falling victim to phishing attempts or scams. Understanding how to check Bitcoin transaction confirmations allows you to confidently navigate the cryptocurrency landscape and make informed decisions regarding your digital assets.


.png)